Analyzing CPU Usage With Powershell, WMI, and Excel
Posted on November 14, 2020
- and tagged as
- performance,
- powershell
I recently needed to cobble together quick and dirty CPU monitoring to tackle an issue, and not being a huge fan of perfmon I decided to use PowerShell to pull the data and write it to a CSV file that I could analyze with PowerShell and Excel. This has the advantage of being configurable entirely on the command line, and therefore can be done via WinRM or other management software.
There are however a number of ways to go about it, and this post will explore a few of them.
What are we capturing
Let’s first define exactly what data we need to capture. For a given system, with a given number of CPU sockets and cores, we want to collect data for each core, as well as total CPU usage across all cores.
Generating CPU load with PowerShell and setting CPU Affinity
For the purpose of this post I’ve written a short function in PowerShell to stress a CPU, with the ability to define how many threads we spawn, as well as automatically setting CPU affinity to match the thread count. If we don’t do this, Windows can spread the work between several cores and we may not get a good picture of what is occurring.
CPU Affinity
This is something that is often overlooked - a single thread can be bounced between cores. The thread is still bound to the performance of a single core, but you won’t actually see any one core at 100% capacity. The work is being passed from core to core as Windows sees fit, but never running in parallel on multiple cores.
It’s not something we’re covering here, but this can make performance diagnosis difficult as all your graphs will show less than 100% CPU usage, all the while there is a thread that is entirely CPU bound. One simple way to root these out is to look for processes which have CPU usage of 100 / number of cores. I.e, if you have a 4 core system, and a process that is consistently at 25% CPU utilization, chances are you’re hitting that single core limit.
Let’s take a look at an example to illustrate the point. We’re going to use this snippet to fully utilize a single core.
while ($true) {}If we run the above code in a PowerShell window with no affinity settings we’ll get something resembling the following.
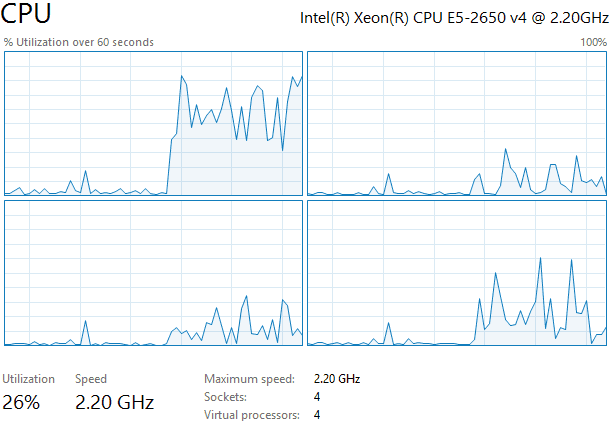
Most of the work is being done by the first core, but the it isn’t fully utilized, and the other cores are doing some of the work as well. Despite the other cores being involved, our utilization is only 26%, essentially a quarter of total system processor capacity.
Let’s now lock the PowerShell process to the first core and repeat the test.
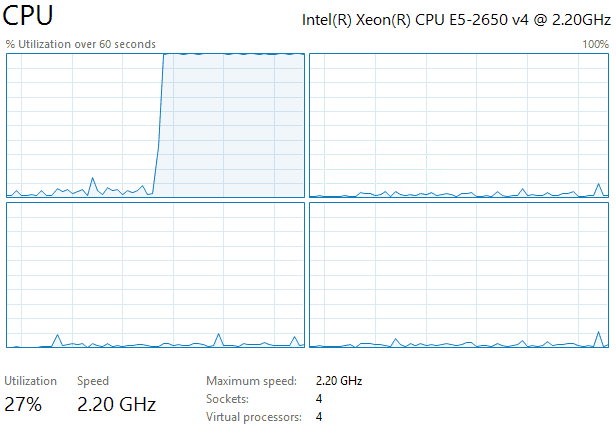
This gives us a much clearer picture of what is happening, our usage is again around the 25% mark (the additional 2% are background Windows functions - there is nothing else running on this test system), showing that we’re only running a single thread, but now it’s locked to one core.
With all of that in mind, here is our CPU core stress test function. It only takes a single parameter, the number of threads, and with that it applies the correct CPU affinity settings, and runs the tests. We’re using ForEach-Object -Parallel for simplicity so PowerShell 7 will be required if you’re following along.
function CoreStress ([int]$Threads = 1) {
    $Mask = 0; 1..$Threads | % { $Mask = $Mask + [Math]::Pow(2, $_ - 1) }
    (Get-Process -Pid $PID).ProcessorAffinity = [int]$Mask
    1..$Threads | % -ThrottleLimit $Threads -Parallel {
        while ($true) {}
    }
}
Tangent: Generating a specific amount of CPU load
The CoreStress function will generate a workload that will consume 100% of core/CPU resources. But what if we wanted 25% or 50%? This can be accomplished by adding a counter and a sleep to our script. I’m only going to post the actual code that generates the load here, but it’s easy enough to incorporate into the above function should you require more granular control.
$SleepAt = 5000

$i = 0
while ($true) {
    if ($i -eq $SleepAt) {
        [System.Threading.Thread]::Sleep(1)
        $i=0
    }
    else {$i++}
}
Adjusting the SleepAt value will determine the amount of CPU load generated, and will depend on the processor speed - a lower value will lower the load, a higher value will increase the load. For our test system setting the value to 5000 gave us around 50% core utilization.
Now that we have a simple way to generate CPU load, let’s look at a few methods we can use to collect performance data.
Option 1: WMI Win32_Processor
This is the simplest simple option, but has an important caveat that makes it a bad fit if we plan on using our monitoring script across a variety of systems.
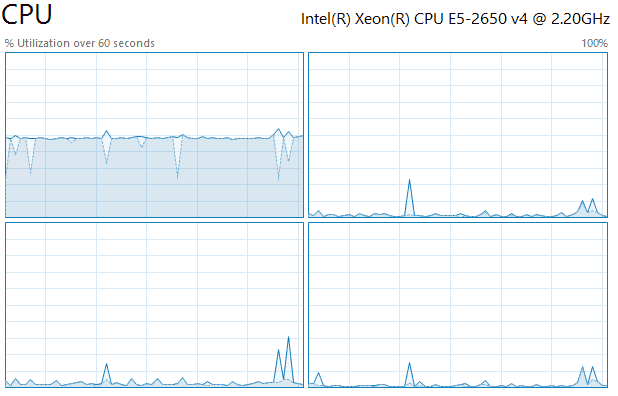
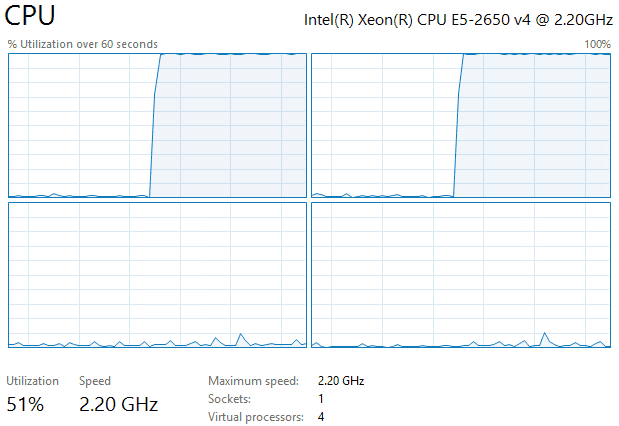
Let’s give it a test using our stress test function and see what results we get. We’re going to be using 2 threads.
CoreStress -Threads 2We already know how this should look in Task Manager, but let’s confirm.
And what does Win32_Processor report?
PS C:\> (Get-CimInstance Win32_Processor).LoadPercentage
100
100
1
1
Looks accurate enough - first two CPUs are at 100%, the remaining two aren’t doing much.
If you’re paying close attention you may have picked up that I wrote two CPUs, not cores. And if we look in our task manager screenshot, we can see this particular system has 4 Sockets, each virtual socket having a single core.
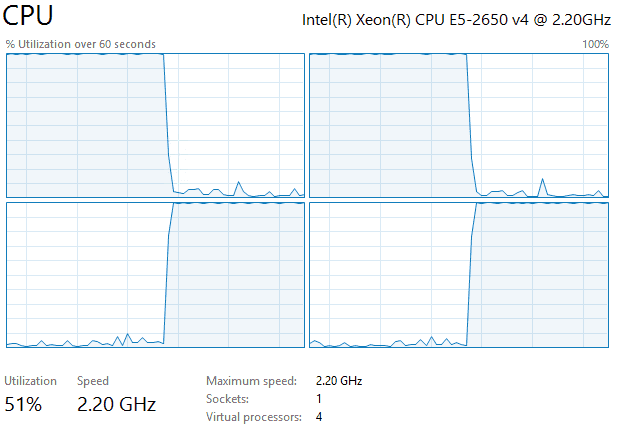
What if we repeat this experiment on single socket, multiple core system? Let’s try it by altering the VM configuration and running the test again.
Now we have a single socket system with 4 cores. What does our simple Win32_Processor report?
PS C:\> (Get-CimInstance Win32_Processor).LoadPercentage
100
That doesn’t look right at all. It’s reporting a single value of 100% usage. Let’s manually change the CPU affinity to use cores 3 and 4, and check again.
PS C:\> (Get-CimInstance Win32_Processor).LoadPercentage
4
Once again, this is way off. You may already see what is occurring here. Win32_Processor looks at the first core in a multicore processor and reports the load on that - other cores are effectively ignored.
This handling of multicore processors rules out using Win32_Processor for any kind of meaningful usage reporting.
Option 2: Get-Counter
Get-Counter seemed like the obvious choice as it lets us read the same data that we can get from perfmon without having to use perfmon. It also has some great features like allowing us to take several samples over a period of time without needing to write our own interval sampling functionality. Let’s take a look at how we can use Get-Counter.
The first thing we need is a list of counters we want to retrieve data about. These would be the same counters we would add in perfmon: there will be a counter per core, as well as a _Total counter that gives us the overall system usage.
We can view all Processor counters with (Get-Counter -ListSet Processor).PathsWithInstances, however, we’re only interested in Processor Time, so we can filter for those.
PS C:\> $Counters = (Get-Counter -ListSet Processor).PathsWithInstances | ? {$_ -match "% Processor Time"}
PS C:\> $Counters
\Processor(0)\% Processor Time
\Processor(1)\% Processor Time
\Processor(2)\% Processor Time
\Processor(3)\% Processor Time
\Processor(_Total)\% Processor Time
Let’s pull some data - I’ll be running CoreStress with a single thread.
PS C:\> Get-Counter $Counters

Timestamp                 CounterSamples
---------                 --------------
13/11/2020 10:14:30 PM    \\testvm\processor(0)\% processor time :
                          100

                          \\testvm\processor(1)\% processor time :
                          0

                          \\testvm\processor(2)\% processor time :
                          1.56130889183759

                          \\testvm\processor(3)\% processor time :
                          0

                          \\testvm\processor(_total)\% processor time :
                          25.3897172155783
This gives us exactly what we’re after, a timestamp, usage for each core, as well as the total system usage.
As mentioned, we can ask for samples to be taken at intervals. Here we’re going to sample CPU utilization 3 times at 5 second intervals.
PS C:\> Get-Counter $Counters -SampleInterval 5 -MaxSamples 3

Timestamp                 CounterSamples
---------                 --------------
13/11/2020 10:16:37 PM    \\testvm\processor(0)\% processor time :
                          100

                          \\testvm\processor(1)\% processor time :
                          0.312147105000748

                          \\testvm\processor(2)\% processor time :
                          1.56215153001642

                          \\testvm\processor(3)\% processor time :
                          0.312147105000748

                          \\testvm\processor(_total)\% processor time :
                          25.546612435008


13/11/2020 10:16:42 PM    \\testvm\processor(0)\% processor time :
                          100

                          \\testvm\processor(1)\% processor time :
                          4.98402395771325

                          \\testvm\processor(2)\% processor time :
                          5.29555174801583

                          \\testvm\processor(3)\% processor time :
                          2.49180163529261

                          \\testvm\processor(_total)\% processor time :
                          28.1928443352554


13/11/2020 10:16:47 PM    \\testvm\processor(0)\% processor time :
                          100

                          \\testvm\processor(1)\% processor time :
                          0.312147105000748

                          \\testvm\processor(2)\% processor time :
                          1.87465263627034

                          \\testvm\processor(3)\% processor time :
                          0.312147105000748

                          \\testvm\processor(_total)\% processor time :
                          25.624736711568
With a little bit of a PowerShell we can get something more than raw values thrown at us.
PS C:\> Get-Counter $Counters -SampleInterval 10 -MaxSamples 5 | `
    Select -ExpandProperty CounterSamples | Select InstanceName, CookedValue | `
    Group-Object -Property InstanceName | % {
        $Stats = $_.Group | Measure-Object -Property CookedValue -Average -Maximum
        $_ | Select `
             @{L="Timestamp";E={(Get-Date).ToString("yyyy-MM-dd HH:mm:ss.ms")}}, `
             Name, `
             @{L="Average"; E={[math]::round(($Stats).Average,2)}}, `
             @{L="Maximum"; E={[math]::round(($Stats).Maximum,2)}}
    }

Timestamp                Name   Average Maximum
---------                ----   ------- -------
2020-11-13 22:31:24.2124 0          100     100
2020-11-13 22:31:24.2124 1         0.69    3.13
2020-11-13 22:31:24.2124 2         1.22    3.28
2020-11-13 22:31:24.2124 3         0.41    1.88
2020-11-13 22:31:24.2124 _total   25.58   27.07
Despite looking a little messy, all we’re doing is taking 5 samples, one every 10 seconds, getting the average and max for each instance, generating a timestamp for the aggregate data, and displaying values rounded to two decimals.
We could now take these values, export them to a CSV for later analysis.
There is one aspect of Get-Counter that I’m not a fan of however, and that is the speed. For the following commands I’ve stopped the CoreStress stress test - so these are being ran on a clean system.
PS C:\> 1..10 | % { Measure-Command {Get-Counter $Counters} | Select -ExpandProperty TotalMilliseconds } | Measure-Object -Average

Count    : 10
Average  : 1003.11925
Average execution time is 1 second, that feels very slow for nothing more than getting some performance counters.
Let’s see if we can do better.
Option 3: WMI Win32_PerfFormattedData_PerfOS_Processor
This last WMI option gives us per core performance, a total, as well as better performance than Get-Counter. Once again, I’ll turn on CoreStress for a single core so we can validate the output.
PS C:\> Get-CimInstance -Query "select Name, PercentProcessorTime from Win32_PerfFormattedData_PerfOS_Processor" | Select Name, PercentProcessorTime

Name   PercentProcessorTime
----   --------------------
_Total                   24
0                       100
1                         0
2                         0
3                         0
The output is a lot simpler than Get-Counter, and is also more performant.
PS C:\> 1..10 | % { Measure-Command {Get-CimInstance -Query "select Name, PercentProcessorTime from Win32_PerfFormattedData_PerfOS_Processor" | Select Name, PercentProcessorTime} | Select -ExpandProperty TotalMilliseconds } | Measure-Object -Average

Count    : 10
Average  : 266.70912
That’s almost a 75% improvement in execution time 👍.
This is the solution I ended up going with, though I added some more code to display all values on a single line in the CSV, otherwise when we add our timestamp we end up duplicating it for each core plus the total, as is seen in the Get-Counter example output.
Putting it together and analyzing the output
Finally, we need to make our data collection run at regular intervals, for that we can use the Timers.Timer class.
$Timer = New-Object -Type Timers.Timer
$Timer.Interval = 10000
Register-ObjectEvent -InputObject $Timer -EventName Elapsed -SourceIdentifier TimerEvent -Action {
    (Get-Date).ToString("yyyy-MM-dd HH:mm:ss.ms"), ((Get-CimInstance -Query "select Name, PercentProcessorTime from Win32_PerfFormattedData_PerfOS_Processor" | Sort-Object -Property Name).PercentProcessorTime -join ",") -join "," | Out-File cpu.txt -Append
}
$Timer.Start()
This will begin execution and run our scriptblock every 10 seconds. The output is a simple CSV file, the first value is the timestamp, followed by the total usage, followed by each core.
2020-11-13 01:29:29.2929,0,0,0,0,0
2020-11-13 01:29:39.2939,0,0,0,0,0
2020-11-13 01:29:49.2949,0,0,0,0,0
2020-11-13 01:29:59.2959,1,6,0,0,0
2020-11-13 01:30:09.309,0,0,0,0,0
2020-11-13 01:30:19.3019,0,0,0,0,0
2020-11-13 01:30:29.3029,19,25,25,19,6
2020-11-13 01:30:39.3039,67,62,87,50,68
2020-11-13 01:30:49.3049,65,50,87,56,68
2020-11-13 01:30:59.3059,70,81,87,50,62
2020-11-13 01:31:09.319,23,12,31,25,25
2020-11-13 01:31:19.3119,73,68,87,62,75
2020-11-13 01:31:29.3129,61,81,62,68,31
2020-11-13 01:31:39.3139,64,62,62,81,50
2020-11-13 01:31:49.3149,75,68,81,93,56
2020-11-13 01:31:59.3159,67,81,81,56,50
2020-11-13 01:32:09.329,53,43,75,50,43
2020-11-13 01:32:19.3219,68,62,56,81,75
2020-11-13 01:32:29.3229,22,68,0,0,19
etc...
To stop collecting data we stop the timer and do a bit of cleanup.
$Timer.Stop()
Get-EventSubscriber | Unregister-Event
Get-Job | Remove-Job
But why use a timer instead of something simpler than Start-Sleep -Seconds 10, or [System.Threading.Thread]::Sleep(). Because we want to collect performance data every 10 seconds, not every 10 seconds + execution time and Start-Sleep overhead (for more on that see my post on scanning a Layer 2 network with PowerShell. Using an interval instead of a sleep allows us to do that.
Now that we have our CSV data we can filter it with PowerShell, import it into Excel or PowerBI, or whatever else we wish. Here is a sample scatter graph made in Excel.
The key for us was correlating certain undesirable events with spikes in CPU usage, where a single core being tied up could cause issues, and we can quickly spot cores 2 and 4 maintaining that 100% utilization for a few minutes around the 1AM mark.

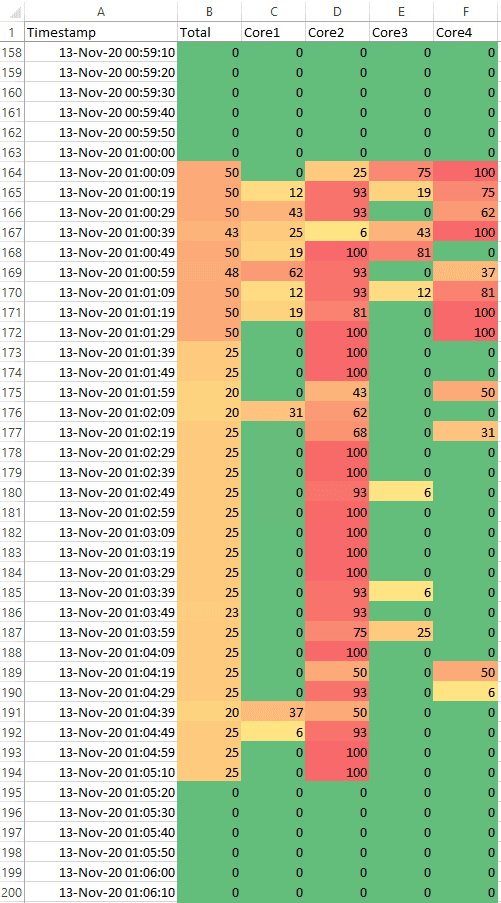
Another easy way to visually analyze this data is to apply Colour Scales using Conditional Formatting. Once again, our CPU spikes stick out.
 .
.
Not to excessively rehash a point already covered, but a big advantage of this approach is that you get per core statistics. Further, we’re also getting raw data, many monitoring tools will quickly start rolling up statistics into averages (as we did with the Get-Counter example). The risk here is that the 1 minute at 100% gets rolled up into 5 minutes of minimal activity and obscures the important spike.
Lastly, this isn’t something you would leave running permanently - I used it to gather data on a specific problem, and once that’s solved the data collection finished.
A parting challenge
That’s all for this post, but I’ll leave you with a parting challenge: using the CoreStress function as a starting point, can you turn your CPU into a wavy boi?
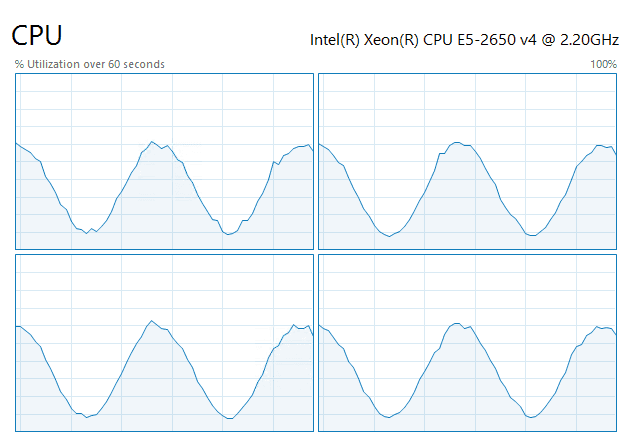
Have fun 😄