Analyzing Thread CPU Utilization with ProcessExplorer, PowerShell, and WMI
Posted on January 12, 2021
- and tagged as
- performance,
- powershell
In a previous post we examined ways to get per core CPU performance data using PowerShell and WMI, and there was a question that we mostly glossed over - how do we know when a thread is CPU bound?
A simple but unreliable method was to look at the CPU usage of a process, and if the usage was hovering at a value that equaled the percentage a single core contributed to the total CPU resources available, then it was likely that a thread within the process was CPU bound.
To illustrate this with an example, if we have a 4 core CPU and a process in Task Manager is sitting at 25% CPU utilization, we can make a guess that a thread within that process is fully utilizing that core.
However, as we saw in the previous post, unless we configure CPU affinity for that process (which we generally don’t want to do), this bottleneck won’t be visible in Task Manager or other CPU graphs as the thread would be moved between cores by the Windows CPU scheduler.
Another downside of this method is that it doesn’t give us any verifiable data - we’re making educated guesses. It could be that two threads within the process are both using 50% of a single core, and making it look as if the process is CPU bound when it is not. It could also be that the CPU utilization of the process is some odd number that doesn’t neatly fit into our division, and we don’t have a good way of knowing what is happening.
So how can we drill into a process to get real data on thread performance?
We’re going to cover two methods: Process Explorer and PowerShell, but first let’s cover why this even matters.
Thread CPU utilization, why do we care?
If you’ve spent time in a sysadmin or similar role you’ve probably been asked to investigate why something is running slow, and to offer solutions for making it run faster.
Long running single threaded operations require us to understand what is happening inside a process, and looking at Task Manager isn’t good enough, as shown by the following screenshot.
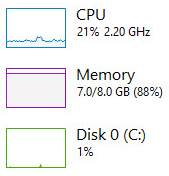
Most people looking at this (albeit exaggerated) example aren’t going to immediately jump to the conclusion that there is a CPU bottleneck, yet, there is a single threaded process running which consuming 100% of a single core.
Even if we look at the CPU graphs it isn’t obvious.
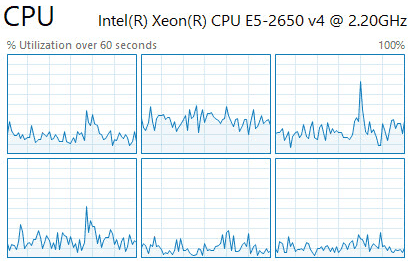
The single threaded workload is being bounced around the cores by the CPU scheduler, so it looks like our CPU utilization couldn’t possibly be the culprit. Even sorting the processes by CPU usage doesn’t show a clear issue.
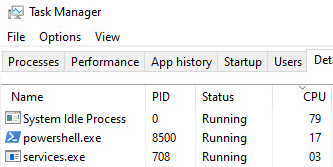
Our bottlenecked process (PowerShell) is only consuming ~17% of the CPU. But if we divide 100 by the number of cores in the system (6), we get 16.6666666666667, and it becomes clearer that it is bound by the performance offered by a single core.
But this is all guesswork, let’s verify that with Process Explorer.
Thread CPU utilization with Process Explorer
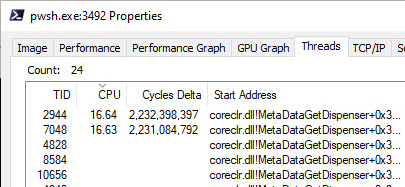
Process Explorer is a fantastic tool that makes it easy to see this data, let’s load it up and look at the properties of the PowerShell process, specifically the Threads tab.
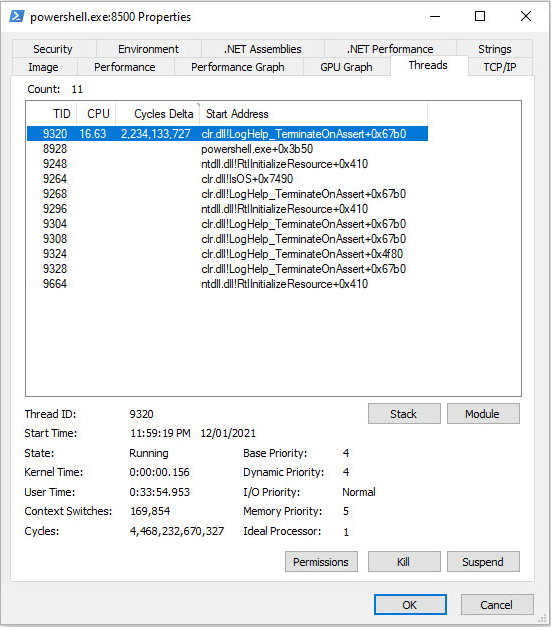
We can immediately see our PowerShell process has a total of 10 threads, one of which is actively doing work, and is consuming ~16.64% percent of the CPU.
This confirms that a single thread is being bottlenecked and that it’s not multiple threads each doing a bit of work to total ~16.6% usage. Further, if the usage was higher, say, 20%, it would still reveal that one thread was fully consuming a core, while another thread could be consuming the remaining ~3.4% on a different core.
Lastly, in the lower section of the screenshot, it shows the User Time, which tells us how long that particular thread has been running for.
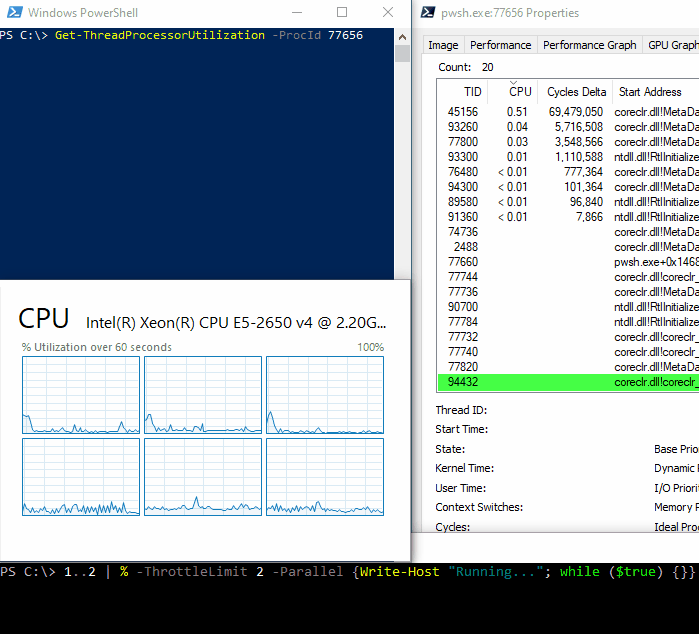
Here is another example, this time PowerShell 7, running two threads, each fully utilizing a single core.
These two threads were created with the following snippet:
1..2 | % -ThrottleLimit 2 -Parallel {while ($true) {}}Let’s move on to getting the same data with PowerShell
Thread CPU utilization with PowerShell and WMI
We’re going to be using a PowerShell 7 process (PID 77656) running the code above to demonstrate how we can pull per thread CPU utilization data.
The WMI class we need to query is Win32_Thread, but the output isn’t immediately useful, similar to how some perfmon counters sometimes need to be be ‘cooked’, we need to do the same type of calculations here.
PS C:\> Get-CimInstance Win32_Thread -filter "ProcessHandle = 77656" | select ProcessHandle, Handle, UserModeTime

ProcessHandle Handle UserModeTime
------------- ------ ------------
77656         77660           312
77656         77732             0
77656         77736            15
77656         77740             0
77656         77744             0
77656         77756             0
77656         77760             0
77656         77784             0
77656         77800             0
77656         77820             0
77656         74736             0
77656         76480           187
77656         2488              0
77656         76388             0
77656         1492              0
77656         77064             0
77656         5988         457593
77656         5984         457484
77656         76452             0
77656         75872             0
77656         77472             0
The ProcessHandle property is our process PID, the Handle property is the Thread ID (TID), UserModeTime is the value we’re after, this is an incrementing value that tells us how much processor time the thread has consumed over the lifetime of the thread.
In order to turn UserModeTime into a useful value, we need to understand what we mean by ‘CPU Usage’ - what are we really measuring?
Understanding CPU Utilization
When we talk about CPU utilization what we’re asking is “for a given period of time, how much of that time did the CPU spend doing work for our thread”. If our given period of time is 6 seconds, and during those 6 seconds a CPU core spent 3 seconds doing work, that would be 50% Utilization.
This is what the UserModeTime property gives us: how much processor time the thread has consumed during it’s lifetime. We can then take periodic snapshots of this value, and use the delta and the time between snapshots to calculate processor utilization.
Calculating CPU Usage from Win32_Thread
With that in mind, we’re going to need to decide what time frame we’re going to collect data over and then do some simple maths to calculate our CPU utilization.
Let’s begin with some code.
function Get-ThreadProcessorUtilization() {

    Param(
        [Parameter(Mandatory=$true)]
        [int]$ProcId,
        [int]$DurationMs = 2000
    )

    $StatsPrev=$null;
    $ThreadAge = @{L="ThreadAge";E={[Timespan]::FromMilliseconds($_.ElapsedTime).ToString("hh\:mm\:ss")}}
    $ProcUtilization = @{L="ProcUtilization";E={(([Math]::Round(($_.UserModeTime - ($StatsPrev | ? Handle -eq $_.Handle).UserModeTime)/($_.ElapsedTime - ($StatsPrev | ? Handle -eq $_.Handle).ElapsedTime)*100,2)).ToString() + "%")}}

    while ($true) {
        $Stopwatch =  [System.Diagnostics.Stopwatch]::StartNew();
        $Stats = Get-CimInstance Win32_Thread -filter "ProcessHandle = $ProcId" | Select ProcessHandle, Handle, UserModeTime, ElapsedTime | Sort-Object -Property UserModeTime -Descending;

        if ($StatsPrev -ne $null) {
            $CurrStats = $Stats | Select-Object ProcessHandle, Handle, $ThreadAge, $ProcUtilization
            Clear-Host
            Write-Output $CurrStats | Format-Table -AutoSize
        }
        $statsPrev=$stats
        $Stopwatch.Stop()
        [System.Threading.Thread]::Sleep($DurationMs-($Stopwatch.ElapsedMilliseconds))
    }
}
There are two input parameters:
$ProcId: The Process Id$DurationMs: The time period we want to collect data over in milliseconds. This can be any value you deem appropriate, 2 seconds is the default.
We then begin our main loop, start a stopwatch, and query Win32_Thread. Once the loop has the first iteration, and written the initial values to $PreviousStats, we can then begin showing actual utilization.
The utilization is being calculated by subtracting the previous iteration’s UserModeTime value from the current UserModeTime value, and dividing by the difference between current and previous ElapsedTime values to give us the core utilization. We then assign the current stats to the $PreviousStats variable, and the process repeats.
We then sleep the loop for the $DurationMs period, minus the amount of time our code took to execute as counted by the Stopwatch. This isn’t particularly necessary here, but we may wish to add functionality in the future, such as logging data to a file, which can begin to skew the duration between loop iterations.
Let’s see this in action, and we’ll include Process Explorer in the image so we can compare thread Ids and CPU utilization. I’ll also configure CPU affinity to lock the PowerShell process to two cores, so we can also verify through Task Manager.
That’s it, we now have a way to determine when a single thread within a process is CPU bound.
Whether you’re using this to diagnose a problem or for performance optimization the function above is a good starting point for building out code for a more specific use case.